Why Are My Near Infrared Spectroscopy (NIRS) Results Late?
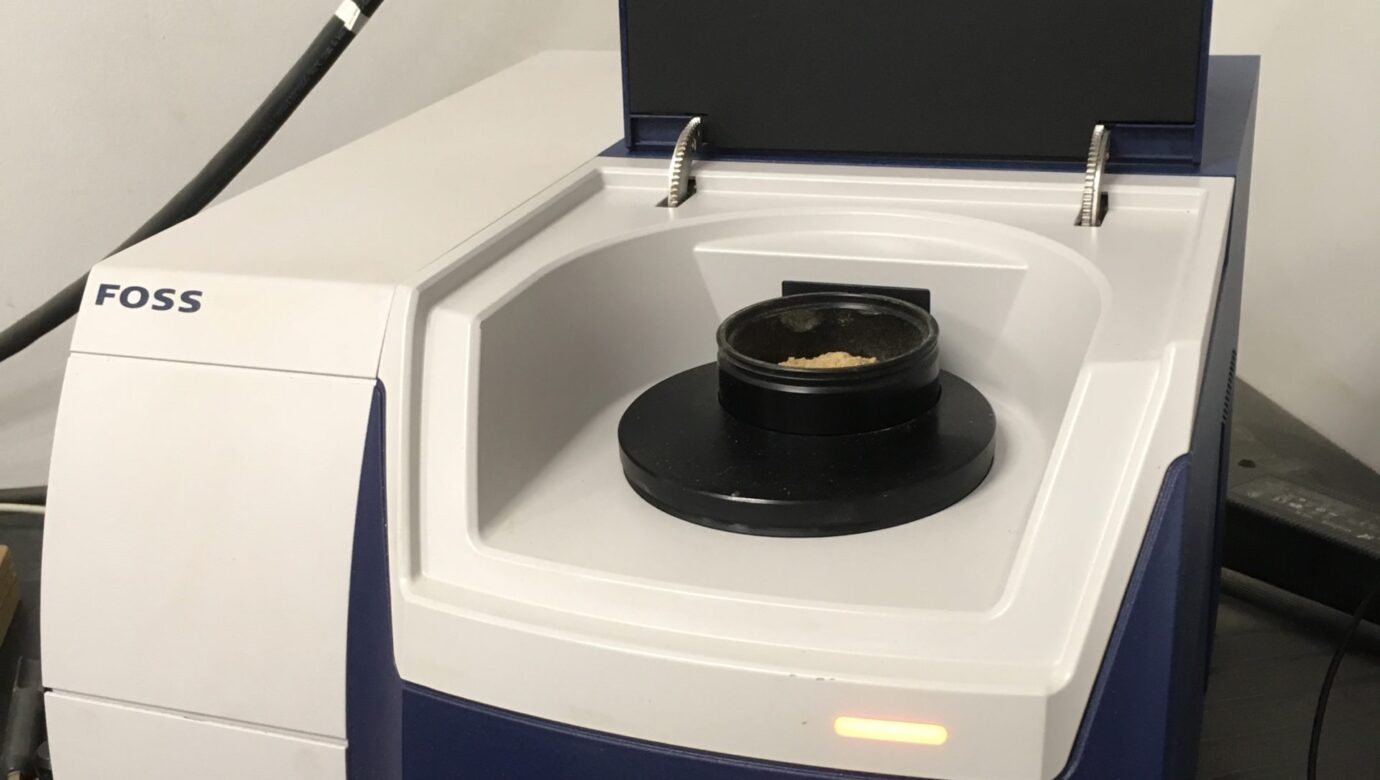
You may notice that when you drop off a sample for NIRS analysis, you are told the results of hay, forage, silage, or corn grain samples will be done in two days. However, once in awhile when you check your email at 5 pm two days later and no reports have arrived in your inbox. Many customers are anxious to receive their results. So why the delay?
Ward Laboratories, INC. is committed to providing accurate, reliable results. So, at the end of each day when the NIRS samples have been scanned, I review the results for each sample. I look at the appearance of the results in the Ward Program. I ensure there are no values predicted as 0, the energy values appear correct, the sample results for, identification, and description matches the login paperwork, and the test is correct for each sample. Additionally, I can view the quality of each NIRS sample scan in the FOSS Program Mosaic Manager Lite.
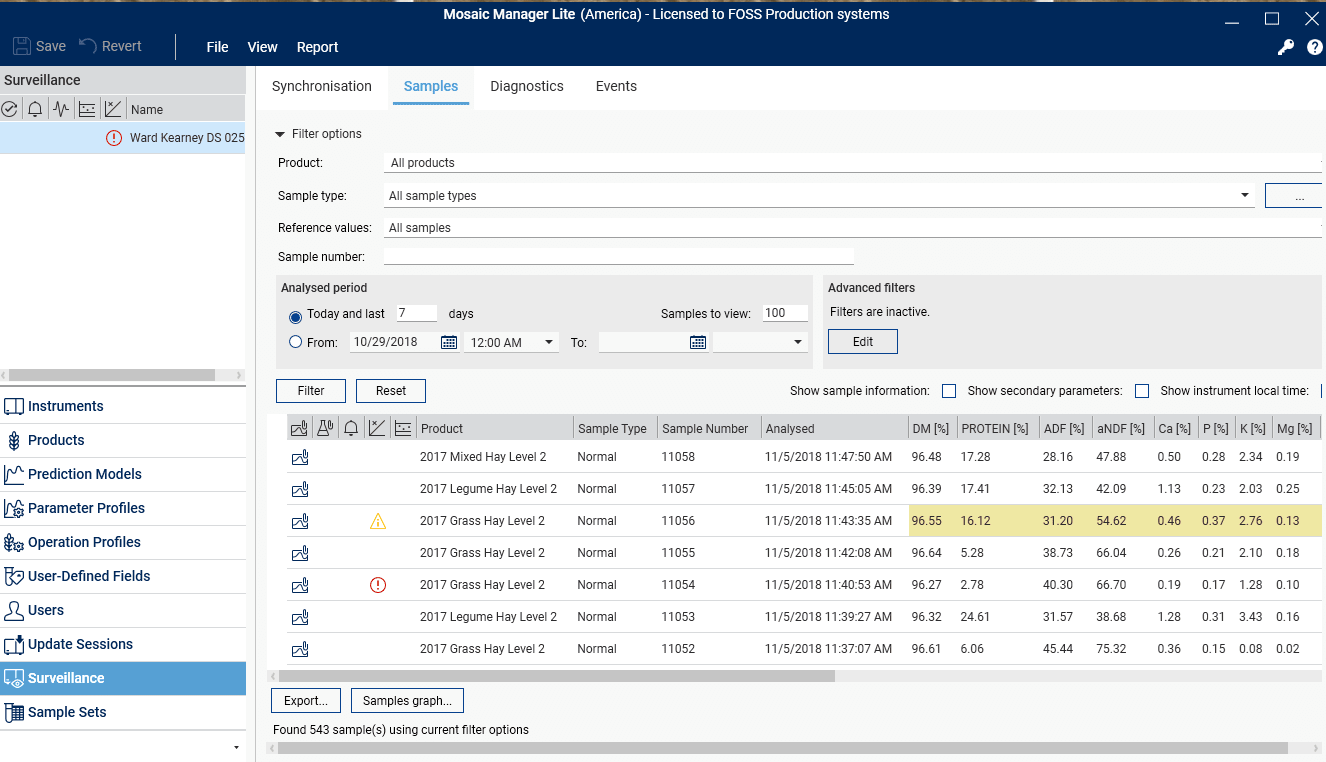
This program highlights samples in either yellow or red if the reflectance wavelengths are outside the local neighborhood H or global neighborhood H respectively for the type of feed scanned. These H statistics indicate if the sample is similar to those in the database used to create the calibration. When a sample is flagged as a poor scan, I investigate the possible reasons for that. First, I look at the equation that the sample was scanned as versus the description of the feed.
In the example below, there was a grass sample which scanned yellow, the description of this feed was millet hay. This indicates, that while the sample is outside the local neighborhood for grass hay samples, it is still inside the global range and likely running wet chemistry results would not differ from the scan predicted results. Therefore, no action is needed. However, if it would have been red indicating the sample was outside the global neighborhood of acceptable wavelengths, the sample would be reran using wet chemistry procedures for crude protein, acid detergent fiber and neutral detergent fiber at no charge to the customer. If the description of the feed would have been mixed hay or alfalfa, then the wrong equation would have been the problem and that sample would be rescanned with the correct equation.

As you can see, this process takes time. First, the NIRS are split, dried and ground. Then, samples go into the lab as a batch containing 40 to 200+ samples. Next, the technician scans the samples. At 4:00 pm each day, I review all the samples for that batch. Next, I communicate with the lab which samples need rescanning under different equations and which samples need to be ran using wet chemistry procedures. Then, the laboratory technicians do their best to get these samples added to that day’s work load. Finally, I review the results again before they are sent out to our customers. Therefore, if a NIRS sample is delayed, the new typical turn around time is 3 business days instead of 2 or on very busy days in the lab 4 business days.
Here at Ward Laboratories, INC., we do our best to provide timely and accurate results. If you do not receive a report when you expected it, feel free to call or email the lab. If your samples were NIRS, the typical hold up is due to the quality control process explained above. Of course, I am human, and I do not catch all errors on reports. So never hesitate to call if something seems incorrect and I will investigate and return precise, accurate, and reliable results.

1 Comment-
Pingback: Confidence In NIRS Analysis of Forages - %