
Variation in DDGS
Variation in DDGS may be more than most think! Most industry professionals would recommend testing a load of DDGS occasionally, especially when switching sources, however they don’t expect to see significant changes in nutritional value on the lab reports. This may be a misconception that might result in unbalanced rations and supplementation strategies, especially for protein.
Dry Milling Process and Ethanol Co-Products
First, corn grain is milled to reduce particle size. This allows for efficient microbial and enzymatic activity in the fermentation stage. This is the first place where variation can be introduced, from the corn itself to the milling efficiency. Second, the ground corn is mixed with yeast and fermented. Ethanol plants use sulfuric acid to adjust pH for optimal fermentation. This process results in wet distillers’ grains, corn grains with starch removed. Next, distillation and evaporation separate the ethanol, dry distillers’ grains, and whole stillage. Then, the whole stillage is centrifuged, and soluble solids are separated from the condensed distiller solubles, more commonly referred to as syrup. The soluble solids are added back to the DDGS. Ethanol plants market the syrup separately as a liquid feed or add it back to the DDGS to increase energy value.
Meanwhile, the DDGS are centrifuged, and the corn oil is removed to be sold separately. Corn oil is marketed as a feed energy supplement or for biodiesel. This is the most common question beef producers and nutritionists have about DDGS, if the fat content has significantly changed due to improved efficiency of corn oil removal. Our data has shown that over the years, yes, the average fat content has decreased, but the overall range has not changed.
Finally, the grain is dried, and the soluble solids and syrup are added back. The drying process is the most likely piece to determine the nutritional value differences when you see color and texture changes. Under drying would give mold and mycotoxins the opportunity to grow and produce during storage. Meanwhile, over drying can result in ‘burnt’ DDGS and variation in available protein.
What the lab routinely sees
DDGS are routinely analyzed for cattle feeders as well as other livestock species. Common analyses include protein, fiber fractions (ADF, NDF, crude fiber), fat, and key minerals like sulfur and phosphorus. For each of these nutritional parameters we see a range. Crude protein is typically somewhere between approximately 38-28% dry basis, crude fiber ranges from 7-13% dry basis, ADF ranges from 9-19% dry basis and fat is usually between 4-12% dry basis.
A variable load of DDGS
Recently, I was sent the photo seen in Figure 1 from Brad Wilkins, President and General Manager of Pride Grain. He was concerned about the variation he saw in both color and texture from a single load of DDGS delivered to his cooperative. You can see in figure 1 the top left bucket contains golden DDGS, what we would typically expect to see. Then bottom left bucket contains DDGS with an odd berry-like texture. Next to that bucket on the bottom right was a darker blend of DDGS and the top right contained black DDGS. It was surprising that all of these visually variable DDGS came from the same load. Visual variability in color and texture can suggest nutritional variability.
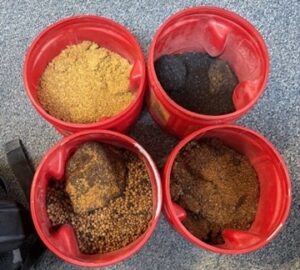
Photo credit: Brad Wilkins
So, we decided to run analysis on each of these four DDGS samples. Color is often associated with heat damage, so we ran heat damage protein in addition to crude protein, ADF and fat. Heat damaged protein measures the protein that has become bound to the low digestibility components of ADF and is therefore no longer available to the cattle. Typically, darker color DDGS indicates over drying and therefore heat damage.
How much variation can be in a single load?
The results of these lab analyses are summarized in Table 1. Summary statistics include the average, standard deviation, and coefficient of variation (CV). CV is calculated as the standard deviation divided by the average, expressed as a percentage. Typically, a CV >10% is considered unacceptable variation for a single sample ran multiple times. So, with each of these samples coming from the same load you can see CVs for heat damaged protein, available protein, and acid detergent fiber were extremely high with values of 93%, 27% and 53% respectively. These high values were all attributed to the black DDGS sample.
Surprisingly, there was not any difference between the first three buckets of DDGS despite color and texture differences visually observed. The heat damaged protein and acid detergent fiber variation between the black DDGS and the other samples, however, was striking. The black DDGS had 12% of its crude protein bound to ADF, which meant only 18.5% crude protein was available to the cattle to be fed even though the total crude protein was 32.7%! Additionally, this heat damage significantly increased the ADF value as well. In practice, this means cattle consuming the black DDGS would receive far less usable protein and energy than expected, unless the ration was adjusted based on lab analysis.
While not displayed here, significant differences in mineral variation were not observed. This makes sense, since the total mineral content itself cannot change, although we cannot evaluate differences in mineral availability.
Table 1. Lab analysis of 4 DDGS samples with varying visual appearance from the same delivered load. All results expressed on a dry basis.
|
Sample ID |
Crude Protein (%) | Heat Damaged Protein (% of Crude Protein) | Available Protein (%) | Acid Detergent Fiber (%) | Fat (%) |
| GOLDEN |
33 |
2 |
33 | 13.3 |
6.8 |
| BERRIES |
37.3 |
2.7 | 37.3 | 11.2 |
6.6 |
| DARK BROWN |
34 |
3.5 | 34 | 14.8 |
6.2 |
| BLACK |
32.7 |
12.1 | 18.5 | 31.5 |
6.7 |
| Average |
34.3 |
5.1 | 30.7 | 17.7 |
6.6 |
| Standard Dev. |
2.1 |
4.7 | 8.3 | 9.3 |
0.3 |
| CV | 6% |
93% |
27% | 53% |
4% |
So, what should you do when you receive a load like this?
- Not all DDGS loads are uniform. When a load that is visually variable is received, blend then test, then make nutritional decisions based on reliable values.
- Add heat damaged protein to your lab analysis. When you see variation in color, it is likely due to the drying process and can significantly impact available protein and downstream ration balancing and supplementation strategy success. So, when you see dark colors, add heat damage protein to the analysis.
- More frequent sampling. When sampling DDGS, sampling more frequently and even multiple samples from the same load can help ensure accuracy in feed values used to make nutritional decisions. This will result in cattle performing as expected. When these factors aren’t considered, producers may be left scratching their heads trying to figure out why cattle didn’t gain or perform as expected.
- Adjust rations and supplementation according to lab reports and available protein. In addition to the changes in protein, higher ADF also means lower energy value for the DDGS. So, be sure to take that into account too.
DDGS are a valuable protein and energy source for both feedlot cattle and as a supplement for cow-calf operations. However, as this example shows, they are not always consistent. Careful observation when receiving loads combined with appropriate lab analysis can ensure DDGS are part of balanced diets to achieve top cattle performance.


