The Hidden Variable in Your Soil Test: Effect of Drying Temperature on Organic Carbon
For decades, farmers, agronomists, and scientists have relied on soil testing as a fundamental tool for managing land. We take soil samples to understand nutrient content and health, making informed decisions about fertilization to ensure crop productivity while managing costs and environmental impact. To get reliable and repeatable results, laboratories worldwide follow a standard first step: they dry the samples. In recent years, there has been a lot of concern about the effect of drying temperature on organic carbon.
Here’s the problem: drying soil is not a neutral act.
A comprehensive review of sixteen research studies reveals that the drying process can dramatically alter soil’s chemical and biological properties. However, the good news is that when done cautiously, these effects can be minimized for most critical measurements, especially soil organic carbon.
Organic Carbon: The Foundation of Soil Health
Let’s start with what matters most to many growers: soil organic carbon. This is the heart of soil health, driving everything from water retention to nutrient cycling. The question is: does our drying method significantly change what we measure?
Data from Mueller (2015) provides compelling evidence that gentle drying at 40-45°C produces organic carbon results remarkably similar to traditional air-drying for most agricultural soils:
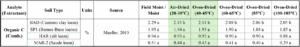
The findings are encouraging:
Low to moderate carbon soils (0.5-2.3% OC) showed no statistically significant difference between air-drying and 40-45°C drying:
- MAR-2 Saude loam (0.51% OC):
- Air-dried = 0.44%, 40-45°C = 0.43% (both group “a”)
- SP1 Barnes-Buse loams (1.95% OC):
- Air-dried = 1.94%, 40-45°C = 1.93% (both group “a”)
- HAR Silt loam (0.94% OC):
- Air-dried = 0.93%, 40-45°C = 0.92% (both group “a”)
- BAD Canisteo clay loam (2.29% OC):
- Air-dried = 2.15%, 40-45°C = 2.11% (both group “b”)
When Carbon Testing Gets Tricky
The story changes for high organic matter soils (>3% OC). In these soils, drying can cause small decreases, though the impact varies:
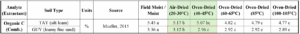
- GUY loamy fine sand (3.36% OC):
- Shows progressive decline with each temperature step
- Field moist = 3.36% (a) → Air-dried = 3.12% (b) → 40-45°C = 2.96% (c)
- Air-drying and 40-45°C are statistically different
- TAY silt loam (5.45% OC): Shows more gradual changes
- Field moist = 5.45% (a) → Air-dried = 5.17% (b) → 40-45°C = 5.07% (bc)
- Air-drying and 40-45°C are NOT statistically different (both share “b”)
The crucial takeaway: 5 out of 6 soils tested showed no statistical difference between air-drying and 40-45°C drying. Even when differences exist, they represent relatively small absolute changes (typically 0.1-0.2% OC). For most management decisions, this level of variation is acceptable, especially when weighed against the practical benefits of faster turnaround times.
The Real Problems Start at Higher Temperatures
The data clearly shows that aggressive drying at temperatures above 60°C causes progressively larger losses in measured organic carbon. By 105°C, losses can exceed 15% of the original value in high-OM soils. This is due to volatilization of low-molecular-weight organic compounds, literally cooking off part of your soil’s carbon.
Special Cases: When Soil Type Changes Everything
Not all soils behave according to the patterns we’ve discussed. Three special cases deserve attention:

An Exception: Peat Soils
- Amorphous peat (28.8% OC): Shows increasing carbon values with temperature
- Air-dried = 28.8% → 40-45°C = 28.9% → 105°C = 31.0%
- This counterintuitive result likely reflects the extreme water-holding capacity of peat
- As peat dries, the concentration effect from water loss (up to 90% moisture) can outweigh any carbon losses
Practical note: Peat soils require special handling and interpretation regardless of drying method
Vertisols and Chromosols: Australian Clay Challenges
- Vertisol (cracking clay): Shows typical pattern but less dramatic than expected
- 100°C drying causes only 6% decrease despite high clay content
- Chromosol (texture-contrast soil): Similar modest decrease at high temperature
- These soils’ unique mineralogy and structure may protect organic matter during drying
- The 40-45°C protocol would likely show minimal effects on these soil type
The Bottom Line
The evidence is clear: for soil organic carbon, arguably the most important indicator of soil health, gentle drying at 40-45°C produces results that are statistically equivalent to traditional air-drying for the vast majority of agricultural soils. This finding alone justifies the use of this drying temperature in commercial laboratories.
Full list of references available upon request.